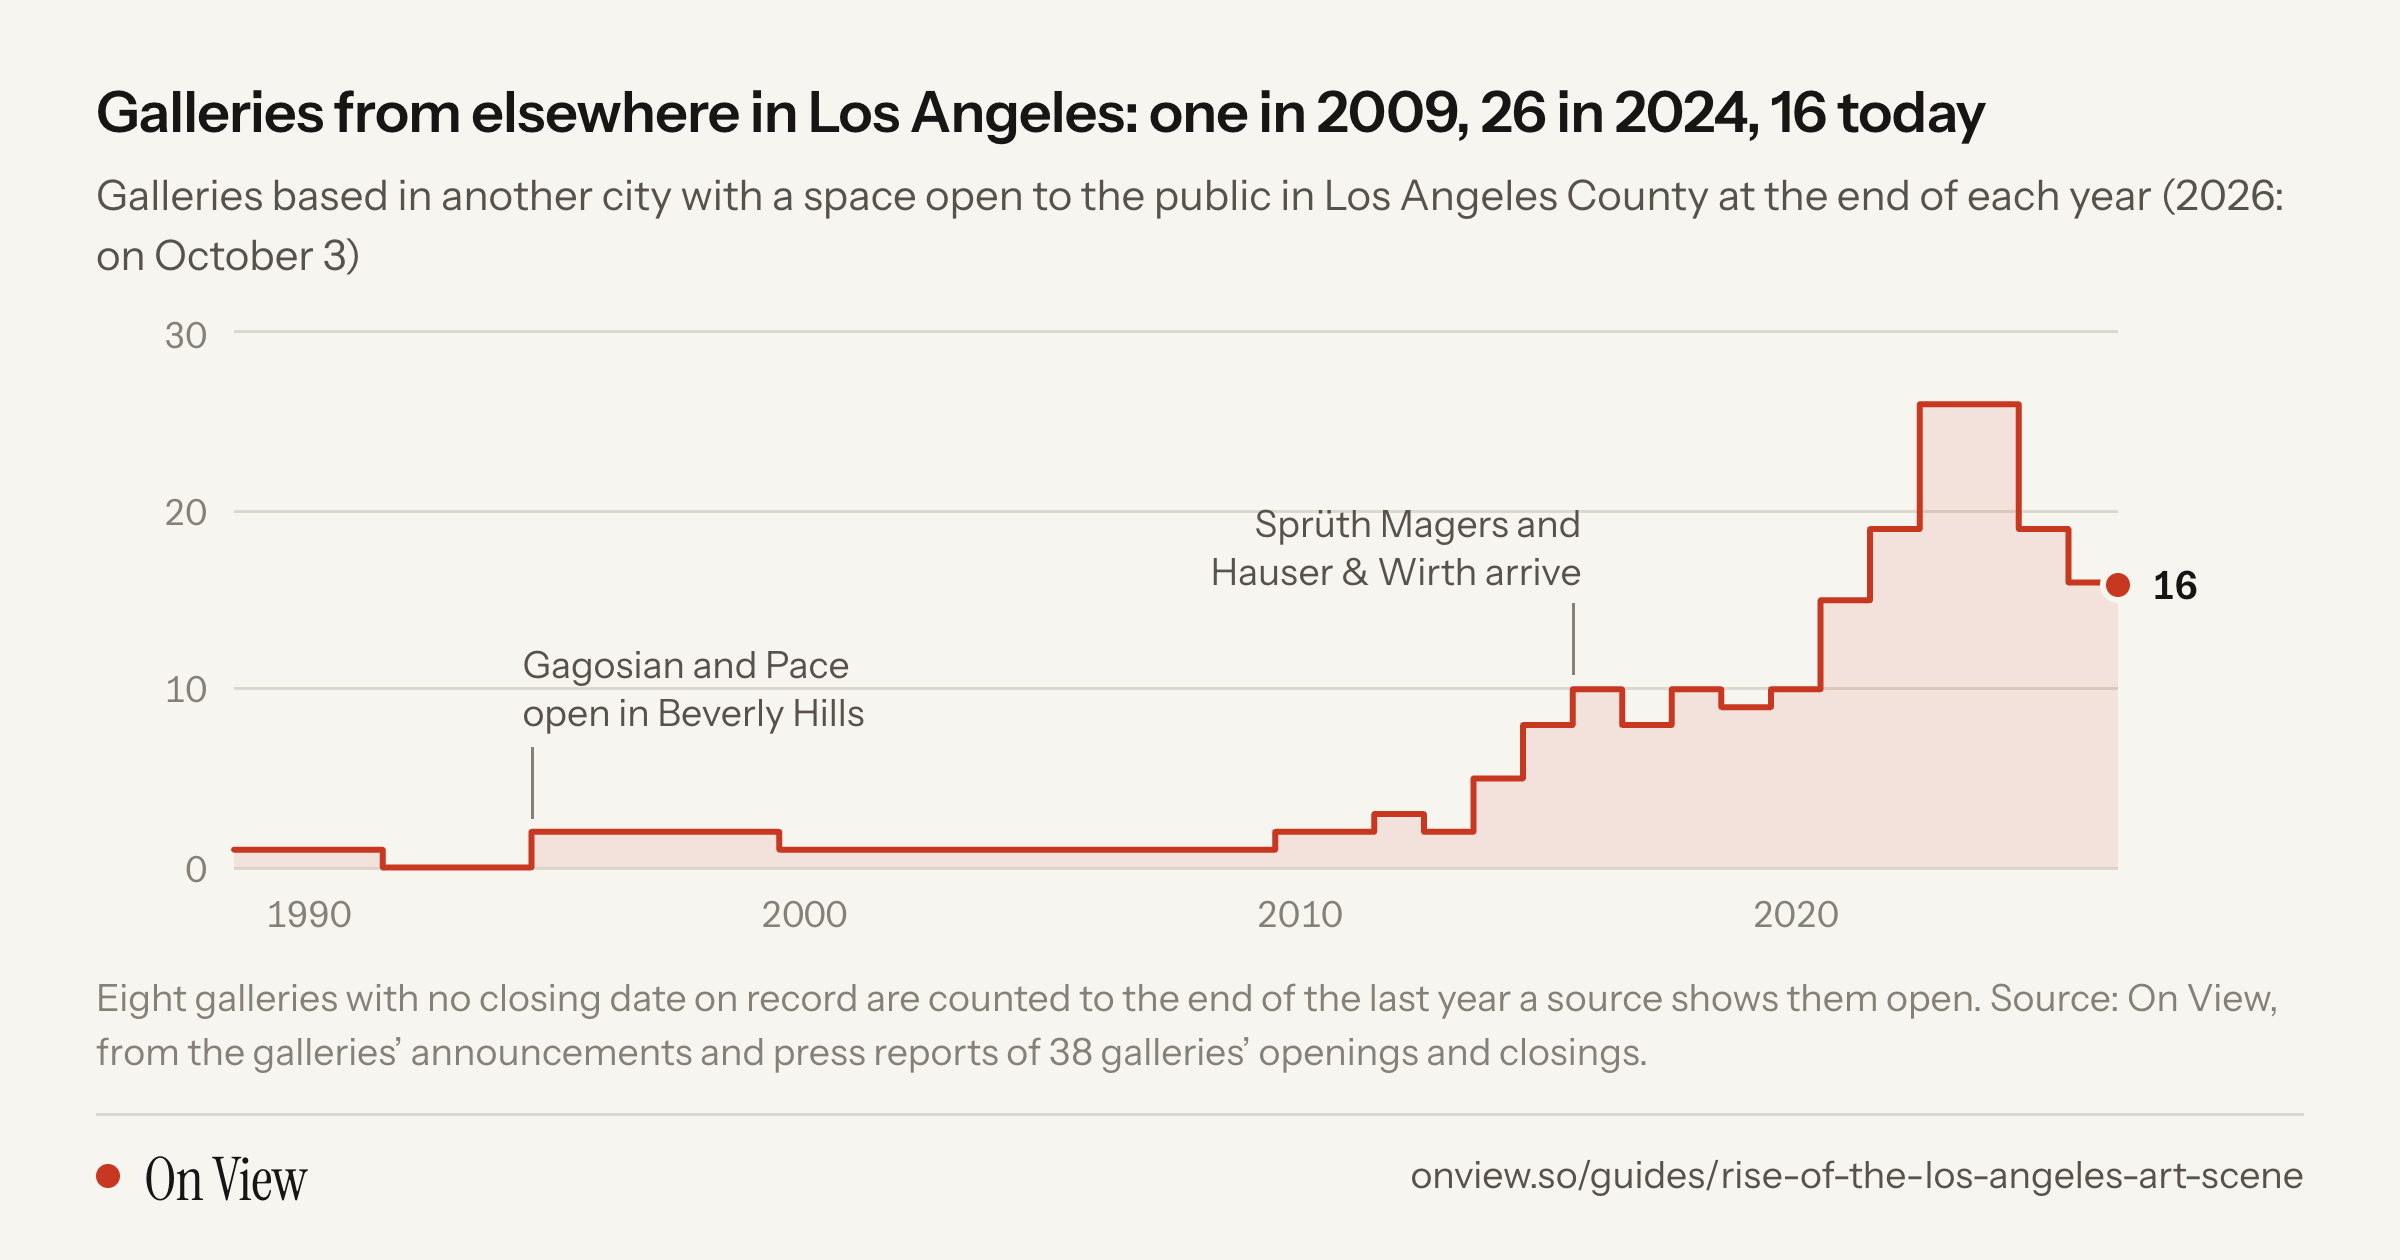
Galleries from elsewhere in Los Angeles: one in 2009, 26 in 2024, 16 today
Galleries based in another city with a space open to the public in Los Angeles County at the end of each year (2026: on October 3)
0102030Gagosian and Pace open in Beverly HillsSprüth Magers and Hauser & Wirth arrive16
The numbers
| Year | Galleries from elsewhere with a Los Angeles space |
|---|---|
| 1989 | 1 |
| 1990 | 1 |
| 1991 | 1 |
| 1992 | 0 |
| 1993 | 0 |
| 1994 | 0 |
| 1995 | 2 |
| 1996 | 2 |
| 1997 | 2 |
| 1998 | 2 |
| 1999 | 2 |
| 2000 | 1 |
| 2001 | 1 |
| 2002 | 1 |
| 2003 | 1 |
| 2004 | 1 |
| 2005 | 1 |
| 2006 | 1 |
| 2007 | 1 |
| 2008 | 1 |
| 2009 | 1 |
| 2010 | 2 |
| 2011 | 2 |
| 2012 | 3 |
| 2013 | 2 |
| 2014 | 5 |
| 2015 | 8 |
| 2016 | 10 |
| 2017 | 8 |
| 2018 | 10 |
| 2019 | 9 |
| 2020 | 10 |
| 2021 | 15 |
| 2022 | 19 |
| 2023 | 26 |
| 2024 | 26 |
| 2025 | 19 |
| 2026 | 16 |
Eight galleries with no closing date on record are counted to the end of the last year a source shows them open. Source: On View, from the galleries’ announcements and press reports of 38 galleries’ openings and closings.
From the report
The rise of the Los Angeles art scene, in charts
Seventy-five years of the city’s art world, counted: the galleries that opened and closed, the square feet they filled, the museums built, the prices paid, and how many of the world’s top-selling artists now have a gallery here.
More from this report15
- Los Angeles in numbers, October 2026
- The Los Angeles art world, 1951 to 2026: 105 openings, closings, shows and sales
- Forty galleries, from the year each opened in Los Angeles to the year it closed
- The leading galleries’ floor space grew eightfold in 24 years, then fell by a seventh
- Hauser & Wirth’s flour mill is nearly four times the size of any other gallery in the city
- Seven in ten of the top 100 contemporary artists now have a gallery in Los Angeles. In 2000, one in ten did
- Gagosian alone represents more than a fifth of the top 100 contemporary artists
- How many of the top 100 contemporary artists had a solo show in Los Angeles each year
- Two of the three costliest museum buildings in the city’s history opened in 2026
- LACMA’s attendance doubled, then halved while it rebuilt
- Pacific Standard Time has more than doubled its audience in three editions
- The highest auction prices for artists of Los Angeles
- Frieze Los Angeles peaked at 124 galleries in 2023 and has settled near 100
- Frieze Los Angeles is about a third the size of the largest art fairs
- The Arts District has more galleries than any other part of Los Angeles